Mandelbrot Fractals Explained
The Mandelbrot set is one of the most famous examples of a fractal — an infinitely complex pattern that is often self-similar at different scales. It is a picture generated on the complex plane by repeatedly applying a very simple mathematical rule.
To understand it, you must first be familiar with complex numbers (z = x + yi), which have both a real part (x) and an imaginary part (y), and can be plotted as points on a plane, just like Cartesian coordinates.
The simple rule used to define the Mandelbrot set is the iterative function:
zn+1 = zn2 + c
where z and c are complex numbers, and n represents the number of times the function has been repeated (the iteration number).
Here's how it works for a given complex number c (this c value represents a single point on the complex plane):
- Start with the initial value z0 = 0.
- Plug z0 into the formula to find the next value, z1 = z02 + c.
- Take the result z1 and plug it back into the formula to find z2, and so on. This sequence of numbers (z0, z1, z2, …) is called the orbit of 0.
The Mandelbrot set, often denoted by M, consists of all the c-values for which this sequence of numbers, or orbit, remains bounded (meaning the numbers do not grow infinitely large or "escape to infinity").
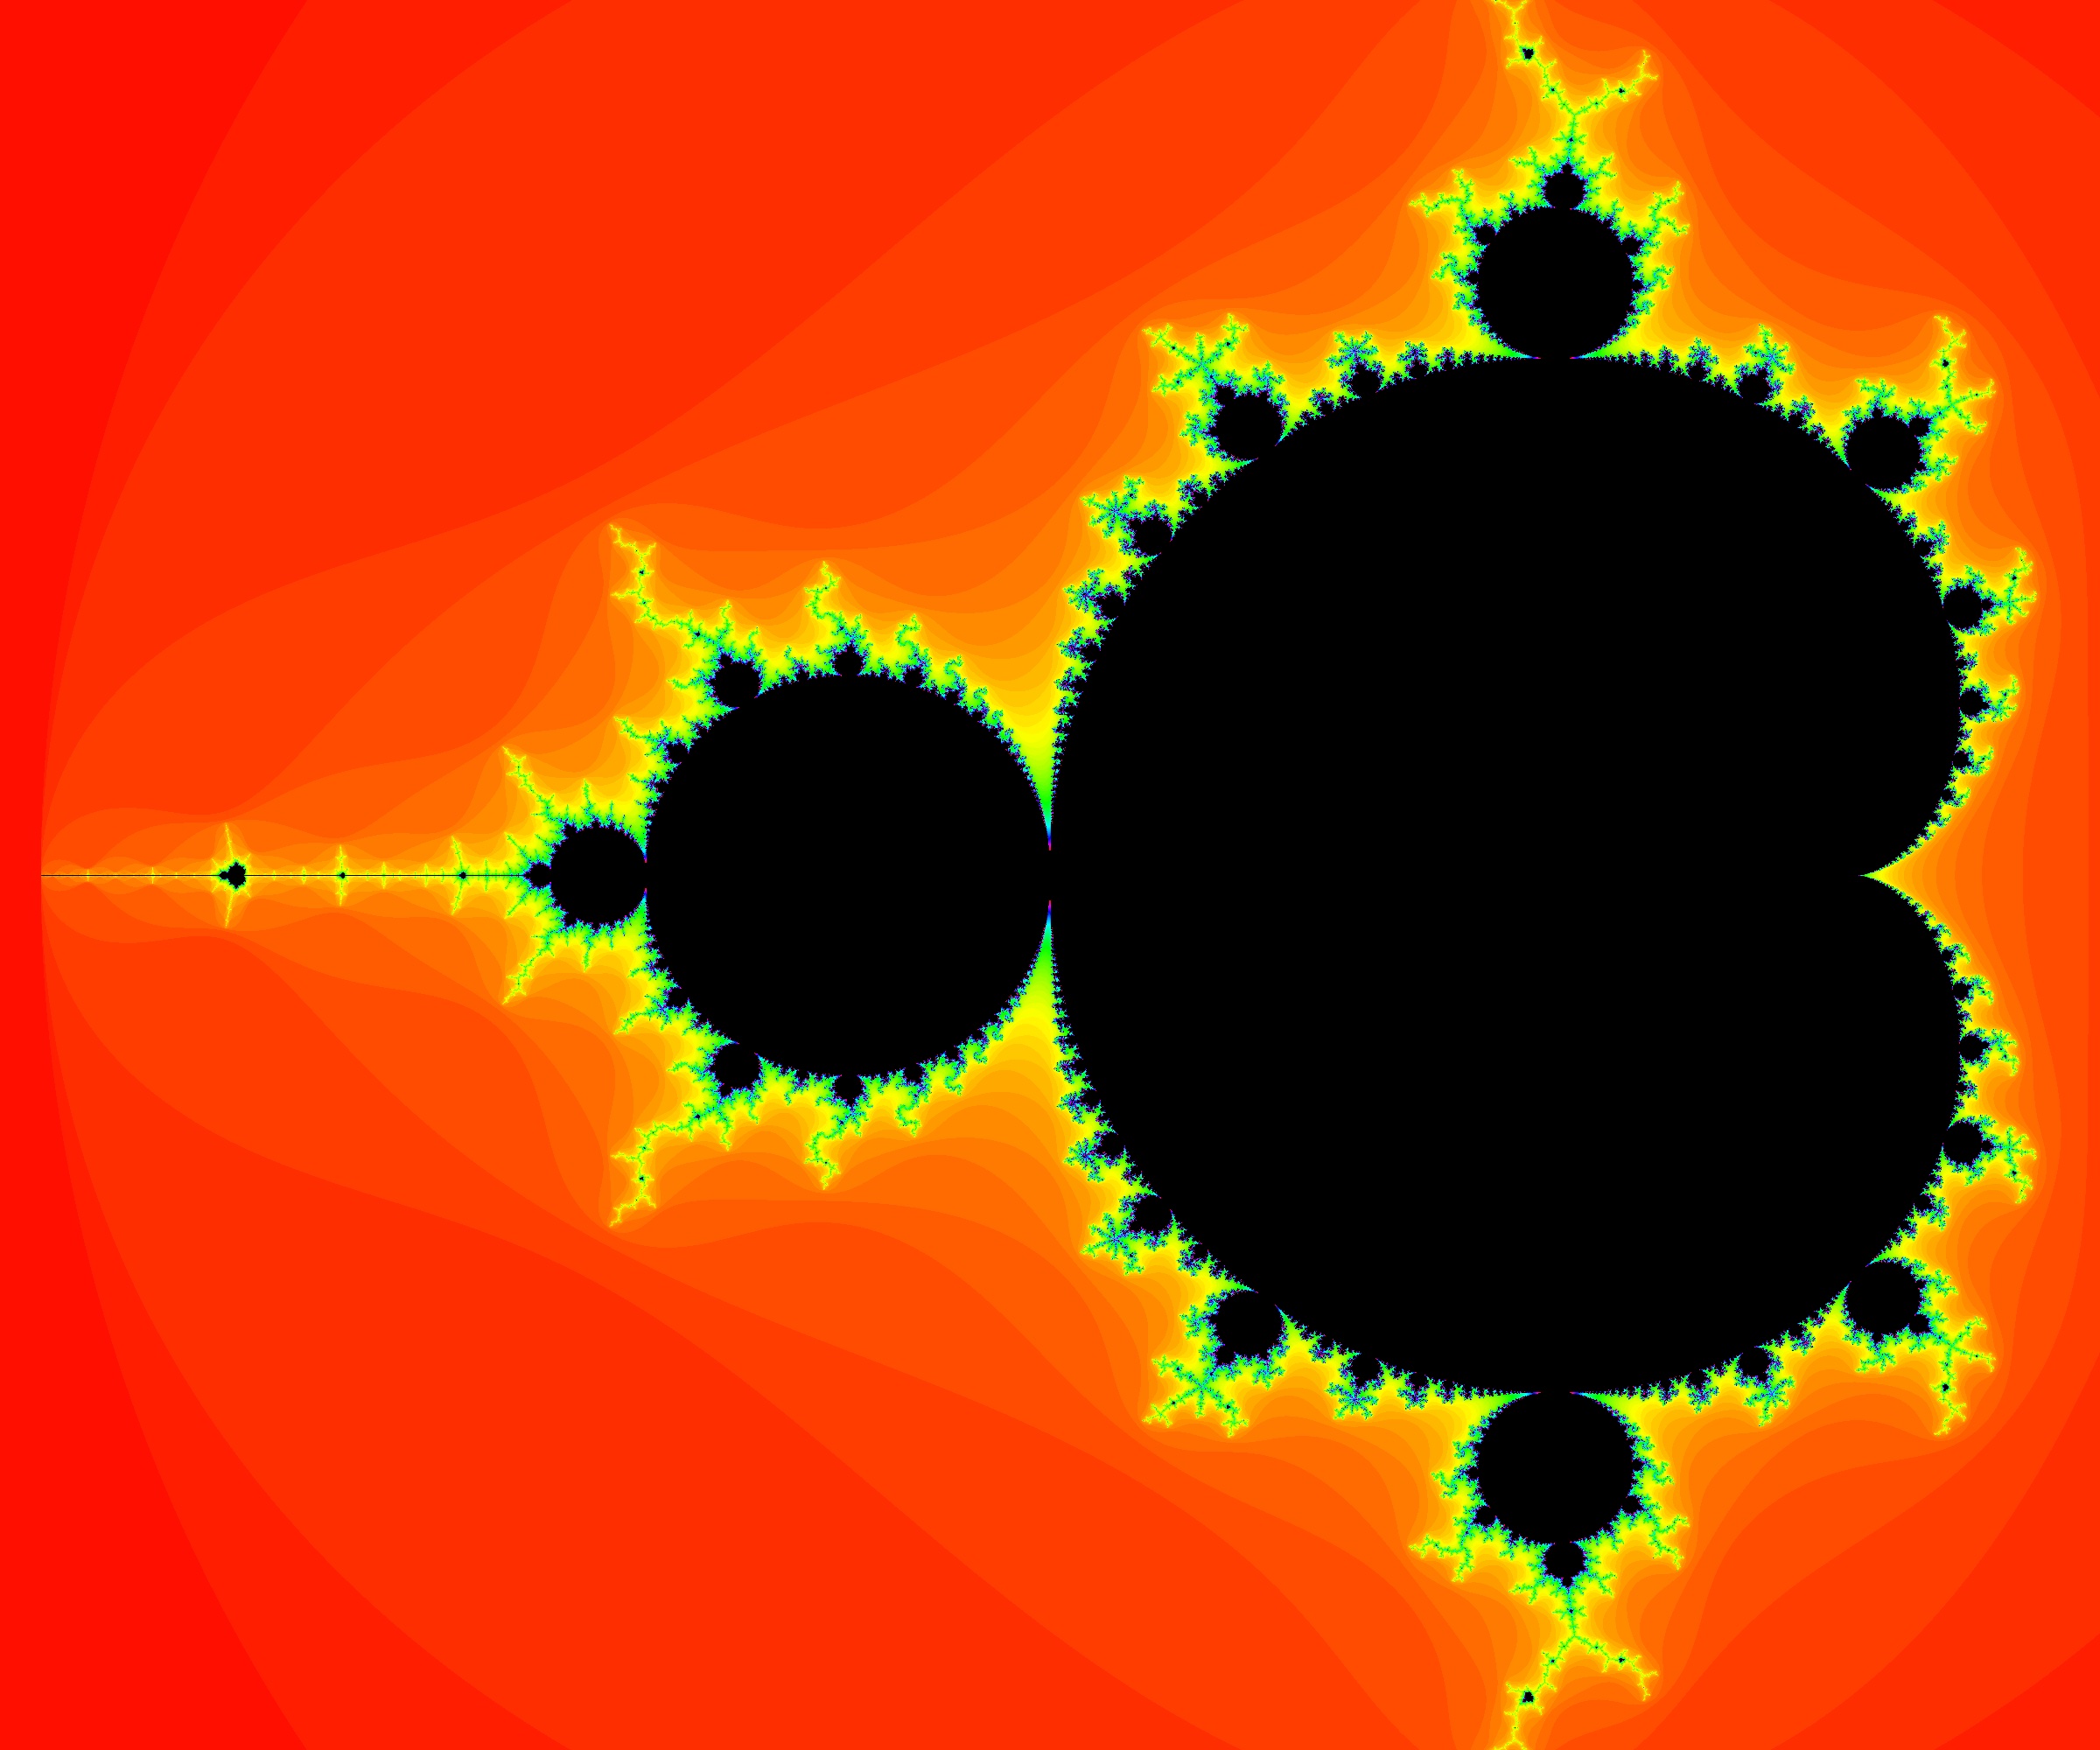
- If the sequence stays within a certain distance (like a circle of radius 2) from the origin, the starting complex number c is colored black (or another solid color) and is considered in the set.
- If the sequence grows larger and larger and tends toward infinity (or "escapes"), the starting complex number c is considered not in the set. These points are typically colored based on how quickly they escape, producing the beautiful, vibrant colors surrounding the black shape.
The resulting image is a "map" that shows how the orbit of 0 behaves for every possible value of c (x — real number, y — imaginary number) on the complex plane.